Ejercicio 211
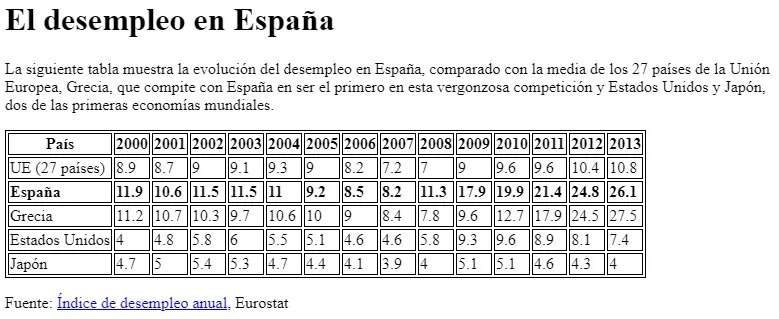
Crea una página web que tenga el mismo aspecto que la siguiente imagen:

El destino del enlace Índice de desempleo anual es la página web:
https://ec.europa.eu/eurostat/statistics-explained/index.php?oldid=220991
El documento HTML base es el siguiente:
<!DOCTYPE html>
<html>
<head>
<title>Desempleo</title>
<style>
table, tr, th, td {
  border: 1px solid black;
}
</style>
</head>
<body>

El desempleo en España


La siguiente tabla muestra la evolución del desempleo en España, comparado con la
media de los 27 países de la Unión Europea, Grecia, que compite con España en ser
el primero en esta vergonzosa competición y Estados Unidos y Japón, dos de las
primeras economías mundiales.


País
2000
2001
2002
2003
2004
2005
2006
2007
2008
2009
2010
2011
2012
2013


UE (27 países)
8.9
8.7
9
9.1
9.3
9
8.2
7.2
7
9
9.6
9.6
10.4
10.8


España
11.9
10.6
11.5
11.5
11
9.2
8.5
8.2
11.3
17.9
19.9
21.4
24.8
26.1


Grecia
11.2
10.7
10.3
9.7
10.6
10
9
8.4
7.8
9.6
12.7
17.9
24.5
27.5


Estados Unidos
4
4.8
5.8
6
5.5
5.1
4.6
4.6
5.8
9.3
9.6
8.9
8.1
7.4


Japón
4.7
5
5.4
5.3
4.7
4.4
4.1
3.9
4
5.1
5.1
4.6
4.3
4


Fuente: Índice de desempleo anual, Eurostat

</body>
</html>
Solución
<!DOCTYPE html>
<html>
  <head>
    <meta charset="UTF-8" />
    <title>Desempleo</title>
    <style>
      table,
      tr,
      th,
      td {
        border: 1px solid black;
      }
    </style>
  </head>
  <body>
    <h1>El desempleo en España</h1>

    <p>
      La siguiente tabla muestra la evolución del desempleo en España, comparado
      con la media de los 27 países de la Unión Europea, Grecia, que compite con
      España en ser el primero en esta vergonzosa competición y Estados Unidos y
      Japón, dos de las primeras economías mundiales.
    </p>

    <table>
      <tr>
        <th>País</th>
        <th>2000</th>
        <th>2001</th>
        <th>2002</th>
        <th>2003</th>
        <th>2004</th>
        <th>2005</th>
        <th>2006</th>
        <th>2007</th>
        <th>2008</th>
        <th>2009</th>
        <th>2010</th>
        <th>2011</th>
        <th>2012</th>
        <th>2013</th>
      </tr>

      <tr>
        <td>UE (27 países)</td>
        <td>8.9</td>
        <td>8.7</td>
        <td>9</td>
        <td>9.1</td>
        <td>9.3</td>
        <td>9</td>
        <td>8.2</td>
        <td>7.2</td>
        <td>7</td>
        <td>9</td>
        <td>9.6</td>
        <td>9.6</td>
        <td>10.4</td>
        <td>10.8</td>
      </tr>

      <tr>
        <td><strong>España</strong></td>
        <td><strong>11.9</strong></td>
        <td><strong>10.6</strong></td>
        <td><strong>11.5</strong></td>
        <td><strong>11.5</strong></td>
        <td><strong>11</strong></td>
        <td><strong>9.2</strong></td>
        <td><strong>8.5</strong></td>
        <td><strong>8.2</strong></td>
        <td><strong>11.3</strong></td>
        <td><strong>17.9</strong></td>
        <td><strong>19.9</strong></td>
        <td><strong>21.4</strong></td>
        <td><strong>24.8</strong></td>
        <td><strong>26.1</strong></td>
      </tr>

      <tr>
        <td>Grecia</td>
        <td>11.2</td>
        <td>10.7</td>
        <td>10.3</td>
        <td>9.7</td>
        <td>10.6</td>
        <td>10</td>
        <td>9</td>
        <td>8.4</td>
        <td>7.8</td>
        <td>9.6</td>
        <td>12.7</td>
        <td>17.9</td>
        <td>24.5</td>
        <td>27.5</td>
      </tr>

      <tr>
        <td>Estados Unidos</td>
        <td>4</td>
        <td>4.8</td>
        <td>5.8</td>
        <td>6</td>
        <td>5.5</td>
        <td>5.1</td>
        <td>4.6</td>
        <td>4.6</td>
        <td>5.8</td>
        <td>9.3</td>
        <td>9.6</td>
        <td>8.9</td>
        <td>8.1</td>
        <td>7.4</td>
      </tr>

      <tr>
        <td>Japón</td>
        <td>4.7</td>
        <td>5</td>
        <td>5.4</td>
        <td>5.3</td>
        <td>4.7</td>
        <td>4.4</td>
        <td>4.1</td>
        <td>3.9</td>
        <td>4</td>
        <td>5.1</td>
        <td>5.1</td>
        <td>4.6</td>
        <td>4.3</td>
        <td>4</td>
      </tr>
    </table>

    <p>
      Fuente:
      <a
        href="https://ec.europa.eu/eurostat/statistics-explained/index.php?oldid=220991"
        >Índice de desempleo anual</a
      >, Eurostat
    </p>
  </body>
</html>
Probar en el navegador